
Enterprises no longer struggle with data access. They struggle with shared meaning across systems, teams, and time.
That gap shows up as metric disputes, slow analytics cycles, and dashboards that drive debate instead of decisions. It also raises risk in AI initiatives when nobody can trace sources or logic.
In 2026, knowledge graphs have moved from experiments to decision infrastructure. Executive scrutiny increased. Teams now need shared meaning, traceability, and governed reasoning that holds up in audits and AI use.
TL;DR: the Best Enterprise Knowledge Graph Platforms are:
- d.AP by digetiers (d.AP): Best overall for ontology-grounded, explainable decision intelligence that makes enterprise meaning reusable across BI, AI, and operations.
- Neo4j (2a): Best for large-scale property graph knowledge graphs and engineered graph applications where performance, graph tooling, and developer ecosystems matter.
- Palantir Foundry: Best for enterprises seeking a full data operating system where knowledge graph concepts support large-scale operational analytics.
- eccenca: Best for ontology-centric semantic integration and knowledge modeling in governance-heavy environments.
- GraphAware: Best for teams that want a partner-led, engineered graph solution built around specific investigative or operational use cases, rather than a packaged KG suite.
The Enterprise Reality That Forces Knowledge Graphs
Enterprise knowledge graphs earn their keep when they remove repeatable friction in how teams define, explain, and reuse metrics. These are the patterns that usually trigger an enterprise platform evaluation.
The 5 Recurring Problems Knowledge Graphs Solve
Siloed systems turn cross-domain questions into projects.
Data silos trap value within specific applications. Answering a straightforward question about "Customer Risk" that spans Sales and Finance data often requires multiple cycles of manual integration work rather than a simple query.
BI bottlenecks queue every KPI behind a small team.
The business waits while users try to work around the system with spreadsheets. Because data models are rigid in traditional tools, exploring new connections requires engineers to build new views for every question.
Inconsistent definitions make metrics political.
"Churn" means one thing to Sales and another to Finance. Data elements drift across tools, teams, and time. Meetings end up focusing on whose number is right rather than how to fix the business problem.
Low traceability leads to distrust.
Leadership ignores dashboards when the logic stays hidden. Without clear lineage, internal audit and compliance reviews turn into manual evidence hunts to prove where numbers came from.
GenAI and RAG fragility create risk.
Ungrounded answers create liability. When context shifts, the model still speaks with confidence, but the organization absorbs the downside. Risk management becomes impossible when AI cannot cite its sources.
Why 2026 Is the Inflection Point
Ontology plus LLM pairing is emerging as the default pattern for reliable enterprise Q&A. Explainability requirements are rising, driven by internal audit, regulatory pressure, and board-level scrutiny of AI systems. Federation and virtualization approaches now fit modern enterprise architecture, where sources shift often and pipelines age fast.
What Counts as an “Enterprise Knowledge Graph Platform”
Buyers often compare platforms that solve different problems, then wonder why pilots stall. Use the archetypes below to separate databases, semantic layers, and full KG platforms based on what they enable in practice.
The Three Platform Archetypes Buyers Confuse
A) Graph databases and RDF stores
These tools offer strong query engines and standards support, but they are primarily storage layers. The risk is that integration, modeling discipline, governance workflows, UX, and AI grounding sit outside the product. The organisation ends up building a platform around a database to deliver governance, explainability, and business UX.
B) Semantic layer and virtualization platforms
These platforms unify access and meaning without moving every dataset. The strength is speed, but the risk is that graph-native exploration, reasoning, and decision traceability often lag. Some tools stop at "consistent metrics" and do not reach the level of "explainable decisions" required for complex relational models.
C) Full enterprise KG platforms
These platforms combine data, semantics, UX, and AI into a single suite. They drive faster adoption across technical and business teams because they include reusable logic and built-in explainability. The risk is higher choice stakes; the platform shapes your operating model, so selection errors cost more.
The Minimum “Enterprise-Grade” Capabilities Checklist
This checklist defines the minimum capabilities that separate an enterprise knowledge graph platform from a database, a semantic layer, or a proof of concept. Use it to screen vendors early. If a platform fails any of these basics, expect slower time-to-value, weaker trust, or higher build effort to fill the gaps.
- Semantic modeling: Ontology support, versioning, reviews, and data governance workflows.
- Federation and integration: Connects via JDBC, REST, files, and supports change cadence strategies.
- Queryable graph: Support for a standard graph query language (like SPARQL or Cypher) and APIs.
- Security and IAM: SSO, SAML, RBAC, and fine-grained permissions.
- Explainability: Lineage, inspectable logic, source attribution, and traceable transformations.
- Operationalization: Dashboards, reusable assets, APIs, and data product outputs.
- LLM grounding pattern: A base requirement in 2026. Evaluate grounding, traceability, and failure handling.
Buyer Evaluation Framework
Once you know what category of platform you are looking at, the next step is scoring it against your decision outcomes and adoption constraints. This framework helps you surface trade-offs early, before you get pulled into feature claims.
Primary Outcome You’re Buying
Pick the outcome first to ensure the platform fits your strategy:
If you need Decision Intelligence, look for self-serve answers with explainable metrics. For a Data Fabric, prioritize shared meaning across systems. If building an AI grounding layer, you need a factual backbone for agents. Some teams focus on Master Data for entity consistency, while others need Operational Intelligence for real-time monitoring.
Data Integration Posture
Decide how data moves based on your latency needs. Federated and zero-ETL approaches fit estates with many systems and frequent change. Cached graph segments are better for workloads that need predictable performance and stable sources. A Hybrid approach fits mixed workloads where some domains need caching while others remain federated.
Semantic Modeling Maturity Required
Ontology-first platforms reward organizations that treat knowledge representation as a product. You must verify who authors ontologies—is it the data team, domain SMEs, or a semantic product team? You also need to confirm how you will version, review, and test ontology changes to prevent metric drift.
Explainability and Trust Model
The platform needs to answer three questions for every result: Where did this come from? What logic ran? What filters, joins, and aggregations shaped the answer? Red flags include AI answers with weak lineage, dashboards where KPI logic is not reusable, or trust that relies on people rather than the system.
Consumption and Operationalization
Evaluate how results reach users. Dashboards should feature semantic widgets and inspectable logic, not static charts. APIs are critical for integration, while Data Products ensure outputs for large analytical workloads have clear ownership and reuse.
Security, Compliance, and Deployment Constraints
Enterprise adoption fails without a security fit. Check Hosting options like EU hosting or customer VPC. Verify Fine-grained permissions at row and concept levels, and ensure adherence to Security standards like SSO and audit logs.
Time-to-Value and Organizational Effort
Buyers need effort predictability. Ask what can go live in under 3 months via a pilot versus what requires a multi-quarter semantic program. Be clear on what the vendor expects from your delivery teams regarding skills and resource time.
Shortlist: The Best Enterprise Knowledge Graph Platforms in 2026
1. d.AP by digetiers (d.AP)
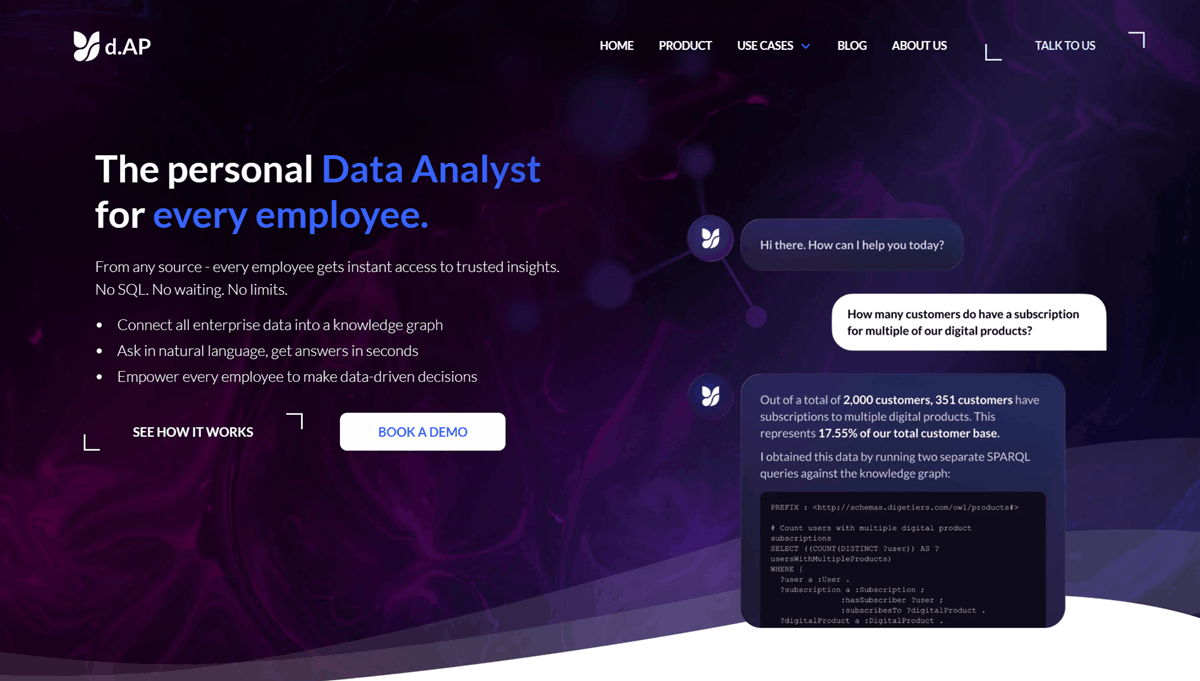
d.AP is a decision-centric enterprise knowledge graph platform grounded in ontologies. Built around RDF and OWL, it has strong support for semantic modelling, governance, and reasoning. It also includes an AI assistant for natural-language, inspectable workflows, so business users can get answers without learning query languages, while teams still retain governance and control. d.AP fits organisations aiming to build a standards-based enterprise knowledge graph and expose it to downstream systems through controlled, well-defined semantics. d.AP’s core strength is disciplined ontology management and inference, which helps teams encode meaning, validate it, and query it consistently at enterprise scale.
Industry Best Fit
Large, asset and process intensive enterprises in regulated or safety critical environments, where decisions depend on shared definitions across operations, finance, supply chain, and compliance. Common fits include manufacturing, energy and utilities, life sciences, and aerospace and defense.
Best-fit Scenarios
Teams committed to RDF and OWL with strong semantic governance. Use cases where reasoning and standards-based interoperability are central, and where the organisation has a clear delivery plan for how the graph will be consumed by analytics, applications, and AI initiatives.
Watch-outs
d.AP suits teams who plan to own definitions. It is not a fit for teams seeking only SQL-style data access, or simple batch ETL modernisation without a semantic component.
What to Test
- Ontology lifecycle: How well it supports versioning, review, and change control.
- Governance: How access controls and policy enforcement behave under real enterprise constraints.
- Performance patterns: How it performs for your real workloads, including reasoning workloads and cross-source access patterns where applicable.
- Coexistence: How cleanly does it sit above your existing platforms and systems without forcing a rebuild?
- Explainability: Can you trace an answer back to the source data, definitions, and logic used?
- Reuse: Can the same KPI or rule drive BI outputs and AI outputs without being rebuilt in each tool?
2. Neo4j
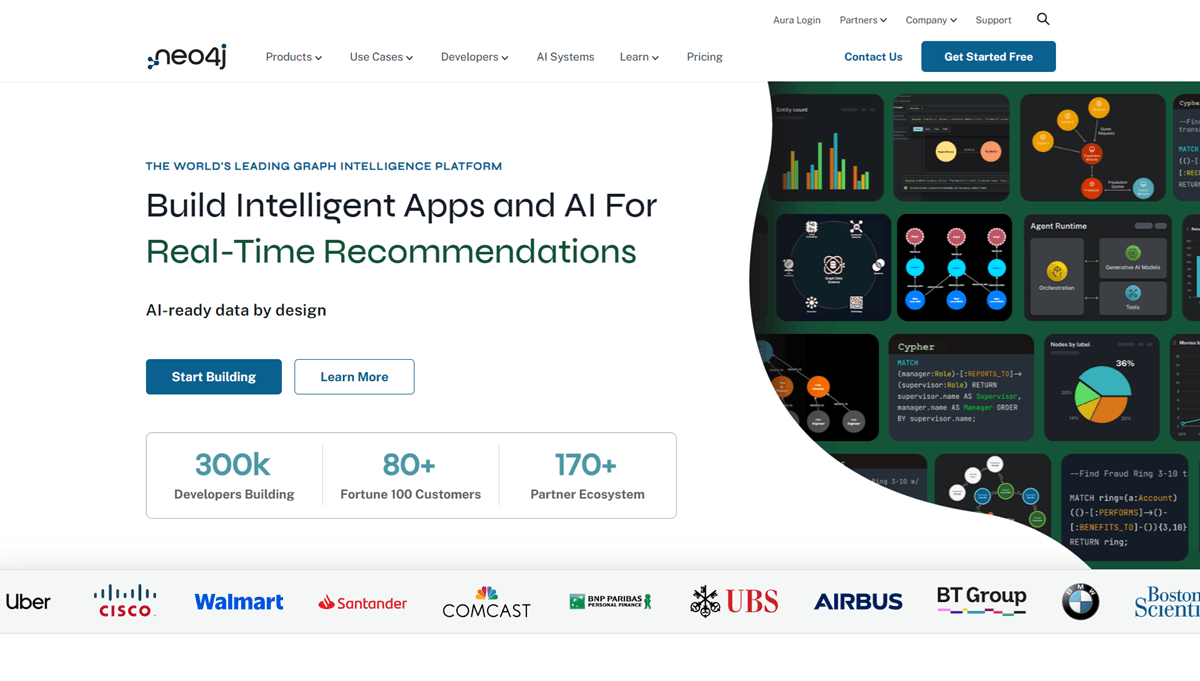
Neo4j is the leading property graph platform, commonly used for high-performance graph applications and large-scale relationship analytics. It is a strong option when you want a graph-native developer experience, mature graph tooling, and a proven ecosystem for building engineered solutions. Neo4j is often chosen for use cases where traversal performance, flexible graph modelling, and application integration matter more than RDF standards and formal reasoning. In enterprise programmes, it is frequently used as the operational graph layer, with semantics, governance, or decision logic handled in adjacent layers depending on the architecture.
Industry Best Fit
Common in financial services, telecoms, e-commerce, and security driven organisations, especially where graphs power production applications.
Best-fit Scenarios
Neo4j fits graph-powered applications that need fast traversal and flexible relationship queries, such as fraud detection, recommendations, network analysis, and dependency mapping. It suits teams prioritising developer velocity and performance over standards-based semantic reasoning.
Watch-outs
Property graph modelling is not the same as RDF and OWL-led semantic modelling. If your programme depends on standards-based inference and ontology governance, you need a clear semantic approach in your architecture.
What to Test
- Query performance for your real traversal patterns and concurrency.
- Operational governance patterns: versioning of the model, access control, and change management.
- Integration patterns with BI and AI consumption, especially if you need explainability.
3. Palantir Foundry
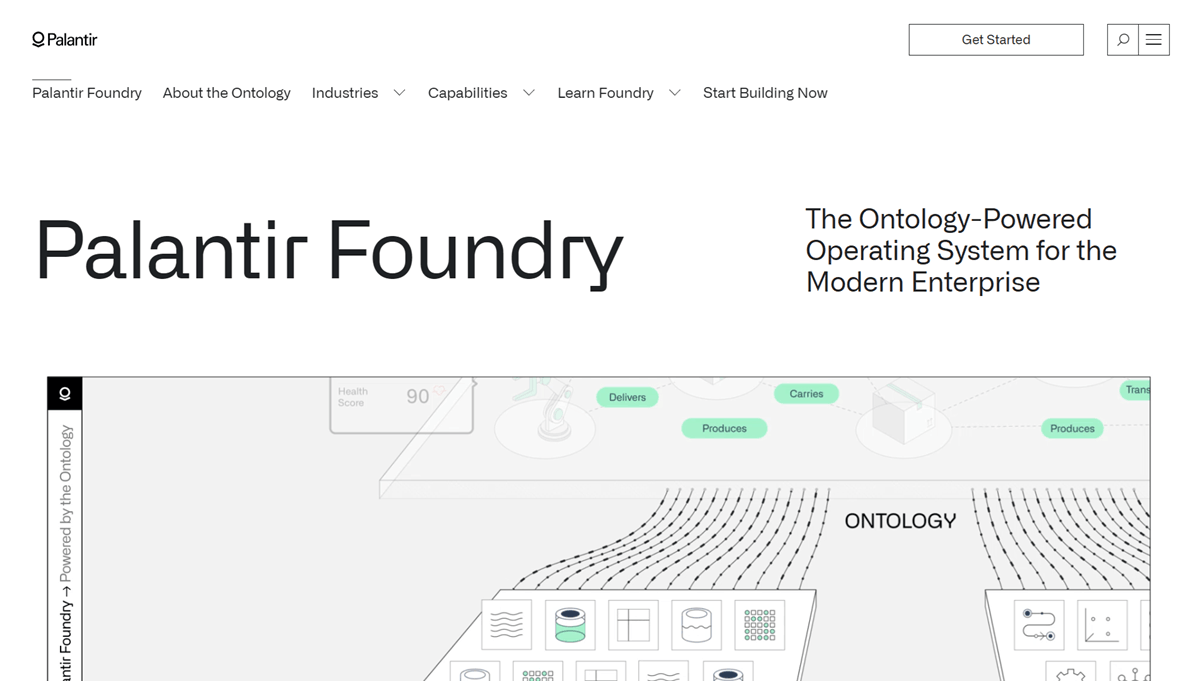
Palantir Foundry is a comprehensive data operating system that includes ontology-style modeling as a core concept. While not a "pure" knowledge graph in the semantic web sense, it uses an "Ontology" to bind objects (like "Customer" or "Factory") to actions and logic. It creates a digital representation of the enterprise where users can interact with data as real-world concepts. Foundry is designed for massive scale and predictive analytics, integrating data ingestion, transformation, analytics, and application building into a single, vertically integrated platform that handles complex queries across massive datasets.
Industry Best Fit
Government, Defense, Aviation, Heavy Industry.
Best-fit Scenarios
Organizations seeking a broad data operating system and willing to commit to platform-scale adoption. Large-scale operational analytics.
Watch-outs
Platform scope and organizational dependency are significant. Cost and effort can be high. Validate time-to-value for your specific KG outcomes.
What to Test
- How "knowledge graph" capabilities surface for exploration.
- Semantics and explainability in your exact use case.
- Integration and governance at scale.
4. eccenca
eccenca is a semantic knowledge graph platform heavily focused on "Corporate Memory" and complex data transparency. It excels at ontology engineering and managing complex product or process relationships across disparate systems. eccenca acts as a multi-model integration platform that links data from ERPs, PLMs, and spreadsheets into a coherent graph. It is particularly strong in sectors where knowledge representation and managing the lifecycle of semantic definitions is often used in governance-heavy environments.
Industry Best Fit
Supply Chain, Manufacturing, Automotive.
Best-fit Scenarios
Semantic integration projects. Knowledge modeling-heavy organizations. Ontology-first initiatives requiring strict governance.
Watch-outs
Validate the end-to-end workflow. Ensure integration, modeling, consumption, and business UX all work together, not just the semantic correctness.
What to Test
- Governance workflows.
- Interoperability standards.
- Operationalization patterns.
5. GraphAware
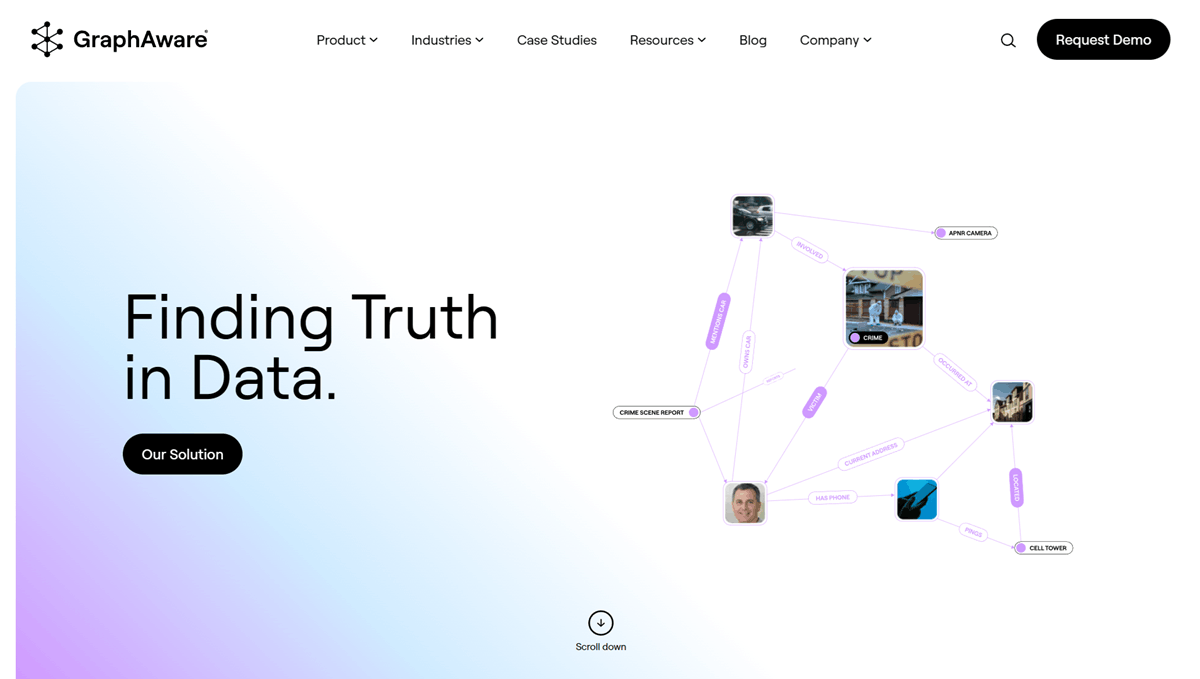
GraphAware is a graph engineering leader that delivers enterprise solutions built on top of graph database technologies like Neo4j. Their flagship product, Hume, is a graph-powered insights engine that focuses on intelligence analysis and criminal investigations. Unlike generic platforms, GraphAware often delivers highly tailored, engineering-heavy solutions that fit specific, complex use cases involving matching patterns in high-volume data. They bridge the gap between a raw graph database and a business application, providing the visualization and analysis tools needed for deep investigations.
Industry Best Fit
Law Enforcement, Intelligence, Security, Financial Crime.
Best-fit Scenarios
When you need bespoke graph solutions and have internal engineering capacity. Intelligence analysis and criminal investigation graphs.
Watch-outs
Implementation burden can shift to services and engineering. Ensure total cost and timeline realism.
What to Test
- Delivery model.
- Maintainability of the custom solution.
- Knowledge transfer processes.
How to Choose the Best Knowledge Graph Platform for Your Enterprise
Platform selection works best when you start with the decisions you need to improve, then match the platform archetype to your semantic maturity and adoption constraints. Use the scenarios below to align your shortlist to outcomes, then validate trade-offs before you commit.
If your #1 goal is explainable answers for business users
Prioritize Natural Language Querying (NLQ) grounded in ontology. Look for built-in explainability and reusable semantic dashboards. Avoid platforms that require heavy bespoke UX builds for every new user question.
Strong fit: d.AP.
If your #1 goal is semantic interoperability across many systems
Prioritize ontology tooling, federation patterns, and governance workflows. Adherence to standards is critical. Avoid platforms that lock logic into proprietary formats.
Likely shortlist: d.AP plus semantic-first vendors like Neo4j or eccenca.
If your #1 goal is enterprise data OS + workflows
Prioritize the operating model, data products, and governance breadth. Ensure you have the implementation capacity. Avoid this path if you only need to solve a specific semantic gap rather than replatforming your data estate.
Consider: Foundry.
Implementation Reality Check
Enterprise knowledge graphs rarely replace your stack. They enter as a semantic and reasoning layer alongside existing BI, warehouses, and operational systems. We’re now going to look at the coexistence patterns and the minimum ownership model needed to move from pilot to production.
Migration and coexistence patterns
Start with one cross-domain question that BI cannot answer quickly today. Coexist with existing BI. The KG becomes the semantic and reasoning layer, while BI consumes curated outputs. Expand the ontology incrementally. Start with a base ontology, add domain extensions, then use-case ontologies. Avoid the "big ontology upfront" trap.
Org design that works
Name an ontology product owner for semantic governance. Define domain stewards as SMEs who validate meaning. Keep a thin platform team for connectors, security, and enablement. Success metric: The ontology owner should be measured by the reduction in metric disputes, not just the number of defined terms.
Time-to-value playbook
Scope the pilot to one or two departments and 3–5 systems. Target 10–20 high-value questions. Success criteria should include cycle time reduction, fewer BI tickets, and measurable trust improvement. Target go-live in under three months for the first real use case.
Pricing, TCO & Effort: What to Model Before You Sign
Licensing is only one part of the cost. Knowledge graphs also introduce ongoing effort in connectors, governance, and semantic change control. Use the checkpoints below to model total cost of ownership and avoid surprises after the contract is signed.
Cost drivers buyers should ask about
Understand the licensing model and scaling unit. Is it based on users, compute, data volume, or "answers"? Clarify implementation and support expectations. Calculate the ongoing semantic program cost, including ontology governance and change management.
The hidden TCO line items
Connector maintenance adds up. Security reviews and compliance documentation take time. Semantic regression testing is required when ontologies change. SME Stewardship: Model the cost of the hours your business experts will spend validating definitions—this is often the biggest hidden operational cost.
d.AP pricing and deployment cues
d.AP offers a SaaS subscription with pilot-based entry. Deployment options include SaaS in a dedicated VPC or PaaS in the customer cloud. Positioning around value-based "answers" maps cost directly to the business outcome.
Final Thoughts & Next Steps
Enterprise knowledge graphs now sit in the critical path of decision making. The pressure comes from metric trust, explainability expectations, and the rise of LLM-driven interfaces. The key choice is not “graph vs no graph.” The choice is which platform model fits your data estate, semantic maturity, and adoption goals.
A platform approach wins when it treats meaning as a governed asset and makes logic inspectable. d.AP fits teams that need decision-centric adoption, ontology-grounded meaning, federated access, and explainable AI that holds up under scrutiny. See how an ontology grounded knowledge graph produces traceable answers across your real sources. Book a dAP walkthrough focused on your highest value operational questions.