
The push to deploy generative AI and agentic workflows has made the limits of fragmented data, data silos, and disconnected systems harder to ignore. When enterprise AI initiatives stall, it’s rarely only a model problem. It’s often a context problem.
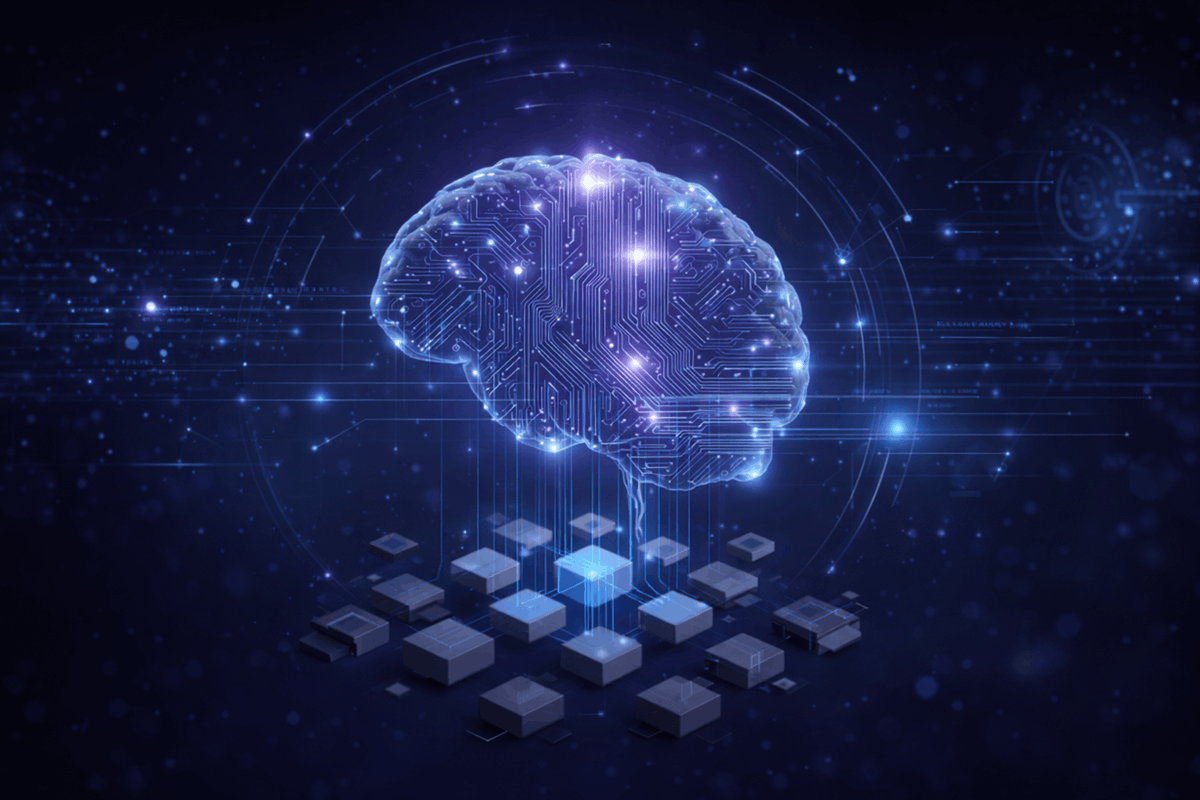
A knowledge graph provides that missing context by modelling the relationships between data. In an enterprise setting, that usually means customers, suppliers, products, contracts, assets, applications, processes, and the governed rules that connect them.
We’ll look at knowledge graph use cases through three practical lenses, being: industry, where the business problem appears; department, where the pain is felt first; and role, where better questions need better answers.
This is also why knowledge graphs are increasingly seen as part of modern data architecture, not only as an AI enhancement.
How to spot a strong knowledge graph use case
Large language models and AI systems have made fragmented enterprise knowledge harder to ignore, but the underlying challenge existed long before RAG became a boardroom priority. The real issue is fragmented enterprise knowledge and not a lack of advanced tooling. When complex questions cut across systems, definitions, and departments, standard dashboards and relational databases often struggle to answer them without repeated modelling, joins, and engineering work.
The strategic advantage of enterprise knowledge graphs is that their value compounds. The same foundational graph can support multiple use cases once the core entities and relationships are modelled. For enterprise buyers, this means the first use case should do enough semantic lifting to make the second and third easier to deploy.
That compounding capability is one reason analysts expect context graphs to play a growing role in enterprise AI agents. AI systems don't only need more data. They need reliable business context they can act on.
The three signals that point to a knowledge graph use case
Before looking at industry-specific applications, it helps to apply a diagnostic lens to your own organisation. The strongest knowledge graph use cases usually share three signals.
1. The question crosses systems
The answers to most high-value enterprise questions don’t live cleanly inside one system. They require access to enterprise data from CRM platforms, ERPs, finance systems, product databases, support tickets, contracts, and external data sources.
Example questions include:
- Which suppliers put our highest-value product lines at risk?
- Which customers are most likely to churn, and which support issues explain why?
- Which downstream applications depend on the legacy system we plan to retire?
- Which product defects connect back to the same component, plant, or supplier?
To get to the answer, a knowledge graph connects data from different systems around shared data entities. It reduces the need to rebuild brittle pipelines and complex table joins every time a new cross-departmental question arises.
That matters because the problem isn’t always where the data is stored. Often, the problem is whether teams share the same meaning when they interpret the data.
2. The answer depends on shared business meaning
Missing data isn’t always the problem. Often, it’s that different teams define the same concept differently, making accurate knowledge management harder than it should be.
For example, sales, finance, and controlling might each define “revenue” using different logic. “Customer,” “account,” and “buyer” can mean different things across billing and support systems. Product hierarchies often clash between engineering, manufacturing, and sales.
An ontology gives the graph a shared understanding of the business model. It defines concepts, relationships, and rules in a way teams can reuse across systems. In more formal enterprise settings, standards such as RDF and OWL help make those meanings machine-readable as well as human-readable.
This is why ontologies and knowledge graphs work better together. The graph connects the data. The ontology defines what those connections mean.
3. The value sits in relationships, not rows
Some business problems are difficult because the answer depends on relationship patterns rather than static table attributes.
Fraud rings, supplier dependency cascades, product quality patterns, hidden customer affinities, application dependency chains, and internal skills networks are all relationship-heavy problems.
Traditional databases can store connected data, but deeply connected queries often become expensive to model, maintain, and scale. A graph structure makes relationships first-class citizens, allowing the enterprise to navigate and interrogate connections directly. However, simply mapping those connections is only the first step; to actually power reliable intelligent applications, your AI needs the formal semantics that an ontology provides, not just a basic property graph.
Where knowledge graphs show up first by industry
Industry patterns show how those three signals become real enterprise use cases. The strongest knowledge graph deployments don’t attempt to model the entire business at once. They start by mapping complex relationships which answer a specific operational question.
Manufacturing and OEM: tracing suppliers, parts, quality, and orders
Manufacturing is relationship-heavy by nature. Products depend on parts, parts depend on suppliers, suppliers depend on regions, and quality issues frequently travel across those connections.
Knowledge graphs map these real-world entities and their relationships at scale. They provide a semantic foundation for supply chain risk management, warranty analysis, bill of materials intelligence, and product quality analytics. Graph architectures are also increasingly used in digital twin platforms for production and operations management, where teams need to understand how assets, processes, events, and dependencies interact.
Example question this helps answer: If supplier X delays part Y by two weeks, which finished products, manufacturing plants, and customer orders are affected?
Pharma and life sciences: connecting compounds, pathways, trials, and evidence
Life sciences teams work with dense scientific relationships. Compounds, proteins, disease pathways, clinical trials, adverse events, publications, and regulatory submissions are all connected.
By linking disparate knowledge bases into a unified graph, researchers can trace relevant evidence across sources without manually searching each system. This connected structure supports drug discovery, target identification, clinical trial design, and real-world evidence analysis. It also gives data science, machine learning, and natural language processing applications a stronger foundation because the underlying biomedical context is easier to query and inspect.
Example question this helps answer: Which compounds in our pipeline target proteins related to this disease pathway, and which past clinical trials have already studied similar targets?
Banking, finance, and insurance: finding risk inside relationship networks
Financial services depend on understanding the hidden relationships between people, accounts, transactions, claims, counterparties, and beneficial owners. Risk often hides in the gaps between these entities.
Graph structures are well suited to uncovering these hidden networks, making them a common architectural pattern for complex fraud detection, AML and KYC entity resolution, and counterparty risk assessment. Instead of analysing data points in isolation, investigators can use graph-based data analytics to spot patterns of suspicious activity across entire portfolios. The same connected structure can also support audit-ready lineage for controlling, financial steering, and regulatory reporting.
Example question this helps answer: This claim looks normal on its own, but is it connected to other claimants, healthcare providers, or accounts involved in previously flagged activity?
Energy and utilities: modelling assets, networks, and operational dependencies
Utilities manage connected physical infrastructure under heavy regulatory pressure. The value sits in understanding the dependencies across transformers, sensors, service areas, maintenance records, and customers.
By modelling these systems and connections, energy companies can improve predictive maintenance, grid modelling, and outage impact analysis. The graph translates isolated data points from IoT sensors into a connected map of operational reality.
Example question this helps answer: If this specific transformer fails, which substations, service areas, and high-priority customers are affected first?
Other industries with strong knowledge graph fit
The Google Knowledge Graph is the most familiar public example of using a semantic network to return relevant search results. Enterprise knowledge graphs solve a different problem: they connect private business data, definitions, and relationships across internal systems.
Healthcare providers use them to map longitudinal patient journeys and clinical care pathways. Retail and e-commerce teams use them for customer 360 initiatives, product knowledge graphs, and recommendation engines. Telecommunications teams use them for network topology mapping and infrastructure dependency analysis. Public sector agencies use them for intelligence analysis, benefits fraud resolution, and supply-chain due diligence.
Which teams feel the value first
Departments are where knowledge graph use cases become funded projects. A CDO might sponsor the architecture, but the first proof point usually comes from a team with a visible bottleneck: sales cannot see cross-sell potential, finance cannot reconcile definitions, supply chain cannot trace risk fast enough, or IT cannot map dependencies with confidence.
Evaluating use cases by department helps identify where fragmented data is causing the most acute operational pain.
Sales and marketing: customer context beyond the CRM
Sales and marketing teams have more customer data than ever, but much of it sits in separate systems. CRM records rarely connect cleanly to billing histories, product usage telemetry, or support tickets.
A knowledge graph integrates data across these boundaries to create a more complete Customer 360 view. It supports account-based marketing, churn risk modelling, and attribution across channels. Most importantly, it surfaces upselling and cross-selling potential by mapping the relationships between what a customer owns, what they need, and what similar accounts are doing.
Example question this helps answer: Which mid-market customers in the DACH region renewed their core contract last quarter and have an open cross-sell opportunity their account executive has not seen?
Finance and controlling: one version of the numbers, with traceable meaning
Finance teams often lose time reconciling definitions before they can analyse performance. When “revenue” is calculated differently in three systems, closing the books becomes a manual investigation.
An ontology-backed graph establishes a shared understanding of financial definitions. This supports financial close processes, improves budget-versus-actuals tracking, and brings transparency to cost allocation. By mapping business context to BI data, finance teams gain audit-ready lineage for controlling, financial steering, and regulatory reporting.
Example question this helps answer: What does revenue mean in this specific report, and does it match the definition approved by finance, controlling, and the audit committee?
Supply chain and operations: seeing disruption before it spreads
Supply chain teams already think in relationships, but their tools often force them to work in disconnected lists, spreadsheets, and static dashboards.
A graph architecture naturally fits the physical reality of the supply chain. It supports supply chain risk management by mapping Tier-N supplier risk, inventory dependencies, and ESG lineage. In production and operations management, it also helps teams understand how a disruption in one area cascades through the rest of the business.
Example question this helps answer: A geopolitical event hits region X. Which suppliers, parts, product lines, plants, and customer orders sit within two hops of that event?
IT, data engineering, and enterprise architecture: mapping the systems behind the business
IT and data engineering teams use knowledge graphs in two distinct ways: as semantic infrastructure for the rest of the business, and as a use case for understanding their own technology estate.
In an IT context, the graph supports Enterprise Architecture Management, application portfolio rationalisation, data lineage, and metadata management. This connected view is particularly useful during M&A integrations, where buy-and-build strategies often require a knowledge layer to map redundant systems, overlapping capabilities, and hidden dependencies.
When systems, owners, capabilities, and dependencies are clearly mapped, architecture decisions become easier to explain and safer to execute.
Example question this helps answer: If we decommission application X next quarter, which downstream services, reports, roles, and business processes will break?
R&D, product, and engineering: making expert knowledge reusable
Engineering and research knowledge often lives in documents, specifications, issue trackers, and people’s heads.
A knowledge graph turns this scattered information into a searchable asset. It powers product quality analytics, technical documentation discovery, requirements traceability, and prior-art search. This requires ontologies to act as a stable foundation, so technical concepts are defined and connected accurately.
Example question this helps answer: Has another engineering team already solved this failure mode, design constraint, or research problem, and where is the evidence?
HR, legal, and compliance: connecting documents, obligations, people, and risk
These teams manage documents and relationships at the same time, making them a natural fit for graph-based modelling.
Use cases include skills and capability mapping, succession planning, contract obligation tracking, and regulatory change impact analysis. For legal and compliance teams, the graph can show how a new regulation connects to contracts, controls, policies, vendors, systems, and accountable owners.
Because compliance depends heavily on defined relationships between entities, ontologies help make enterprise knowledge easier to inspect and reuse.
Example question this helps answer: Which contracts, policies, internal controls, and business owners are affected by this upcoming regulatory change?
What changes for the people asking the questions
Industry and department lenses identify where the graph lives. A role-based lens identifies who the graph empowers. For the people interacting with enterprise data every day, the introduction of a knowledge graph changes what it costs to get an answer.
CDOs and Heads of Data/AI Strategy
What they struggle to answer today: Which AI and analytics use cases deserve semantic infrastructure first? They need to choose between competing demands from finance, operations, product, and IT.
What changes with a knowledge graph: A graph helps them identify common entities across use cases. This means the first deployment serves as a foundation for the next one, rather than a one-off build. This compounding effect is why knowledge graphs are increasingly important to enterprise AI that needs to scale beyond isolated pilots.
CTOs and technology leaders
What they struggle to answer today: How does a knowledge graph fit with our lakehouse, data warehouse, BI stack, and existing data management tools?
What changes with a knowledge graph: A knowledge graph doesn't need to replace every existing system. It can sit above them as a semantic layer that connects enterprise data across sources, much like a unified data fabric, making relationships queryable without requiring a wholesale migration.
Business and data analysts
What they struggle to answer today: Why does every cross-system question become a new IT ticket, dashboard request, or data engineering dependency?
What changes with a knowledge graph: With a queryable ontology, analysts can ask questions using familiar business terms instead of rebuilding join logic each time. This is where semantic layers support more practical self-service analytics.
Operations and product managers
What they struggle to answer today: What is happening right now, what caused it, and which teams or customers are affected?
What changes with a knowledge graph: The graph connects products, processes, suppliers, assets, defects, and customer impact into one navigable structure. That shifts operations from reacting to isolated incidents toward understanding patterns and dependencies earlier.
Domain experts
What they struggle to answer today: Has anyone seen this pattern before, and what did they do? This might be an engineer investigating a defect, or an underwriter checking claim patterns.
What changes with a knowledge graph: A knowledge graph turns expert knowledge into an inspectable enterprise asset. It connects documents, cases, concepts, and past decisions. This is only possible when ontologies act as the intentional core of the architecture.
AI agents
What they struggle to answer today: AI agents don't struggle in the same way humans do. They fail when they act without enough enterprise context.
What changes with a knowledge graph: A knowledge graph gives agents a structured source of business meaning. It helps them ground outputs, retrieve relevant information, and trace answers back to governed entities. For high-stakes enterprise RAG applications, this structured context is often what separates a useful answer from an untrusted one.
How to choose the right first knowledge graph use case
The best first use case isn’t always the most ambitious. It’s the one where a small, well-defined ontology unlocks several important questions at once.
When moving from use-case exploration to actual prioritisation, evaluate your options against these four criteria:
1. Start with questions that cross systems
Ask yourself: Where do important business questions require data from multiple disconnected systems today?
Look for problems like supplier risk (which spans ERPs, contract repositories, external news, and quality systems), customer value (spanning CRM, billing, product usage, and support logs), or application risk (spanning architecture repositories, ownership data, and operational incidents). A knowledge graph natively integrates data from these different systems and data sources, making it uniquely capable of answering complex questions without brittle, point-to-point data engineering.
2. Look for questions that resist standard dashboards
Ask yourself: Which questions are ad hoc, investigative, or hard to standardise?
A traditional dashboard is well suited for monitoring when the question is stable. A knowledge graph becomes useful for data analytics and question answering when the question changes depending on the relationships discovered along the way. It gives analysts and business users dynamic access to relevant information by letting them follow the connections, rather than forcing them down a pre-calculated path.
3. Identify the entities that unlock more than one use case
Ask yourself: Which entities sit at the centre of several business problems?
Likely candidates usually include: Customer, Supplier, Product, Contract, Asset, Application, Process, Location, Employee, Claim, and Transaction.
These data entities, and their connections to other entities, form the beginning of a minimum viable ontology. Once given a formal, structured representation, they can support multiple use cases simultaneously. This compounding value is precisely why ontologies and knowledge graphs work better together: the graph connects the data, and the ontology ensures those core entities are reusable across the business. If you evaluate enterprise knowledge graph platforms, you’ll find the strongest ones prioritize an entity-first modeling approach.
4. Choose a use case that compounds
Ask yourself: Will this first graph make the next use case easier? A strong first use case should prove immediate business value, reuse existing enterprise data, model central entities, and build trust with domain experts. Above all, it should create a foundation for future AI, analytics, and knowledge management use cases.
Use cases are a lens, not a checklist
There is no single master list of knowledge graph use cases. The right use case depends entirely on your industry, your department, and your role.
However, the strongest use cases share common, undeniable signals: fragmented data, shared meaning problems, and high-value relationships. Enterprises are moving rapidly from curiosity to prioritisation. The right first use case is not necessarily the flashiest AI agent or the largest data integration project. It’s the one whose ontology unlocks the next two.
The real value of an enterprise knowledge graph isn’t one single use case. It’s the ability to make connected enterprise knowledge reusable across the questions that come next.